Simulations are the main purpose of the tool, they will visually show you what you've built and what your currencies are up to. It has a number of different settings, Steps, Runs and Time Step. These 3 settings completely control your simulation. The right numbers depend on your GameSim, typically a 100 steps are enough.
What is a Simulation?
A simulation will run through your GameSim a number of times. This is determined by Steps and Runs. One good thing to keep in mind is the following; 1 step equals 1 full simulation of all your nodes and layers. So when you set it to 100 steps, it will run through your nodes a 100 consecutive times.
Each step, the tool will log all sorts of data that we use to visualize what is going on. In particular, it tracks every currency across every step and plots it into a graph for you to see.
The flow for a simulation is as follows:
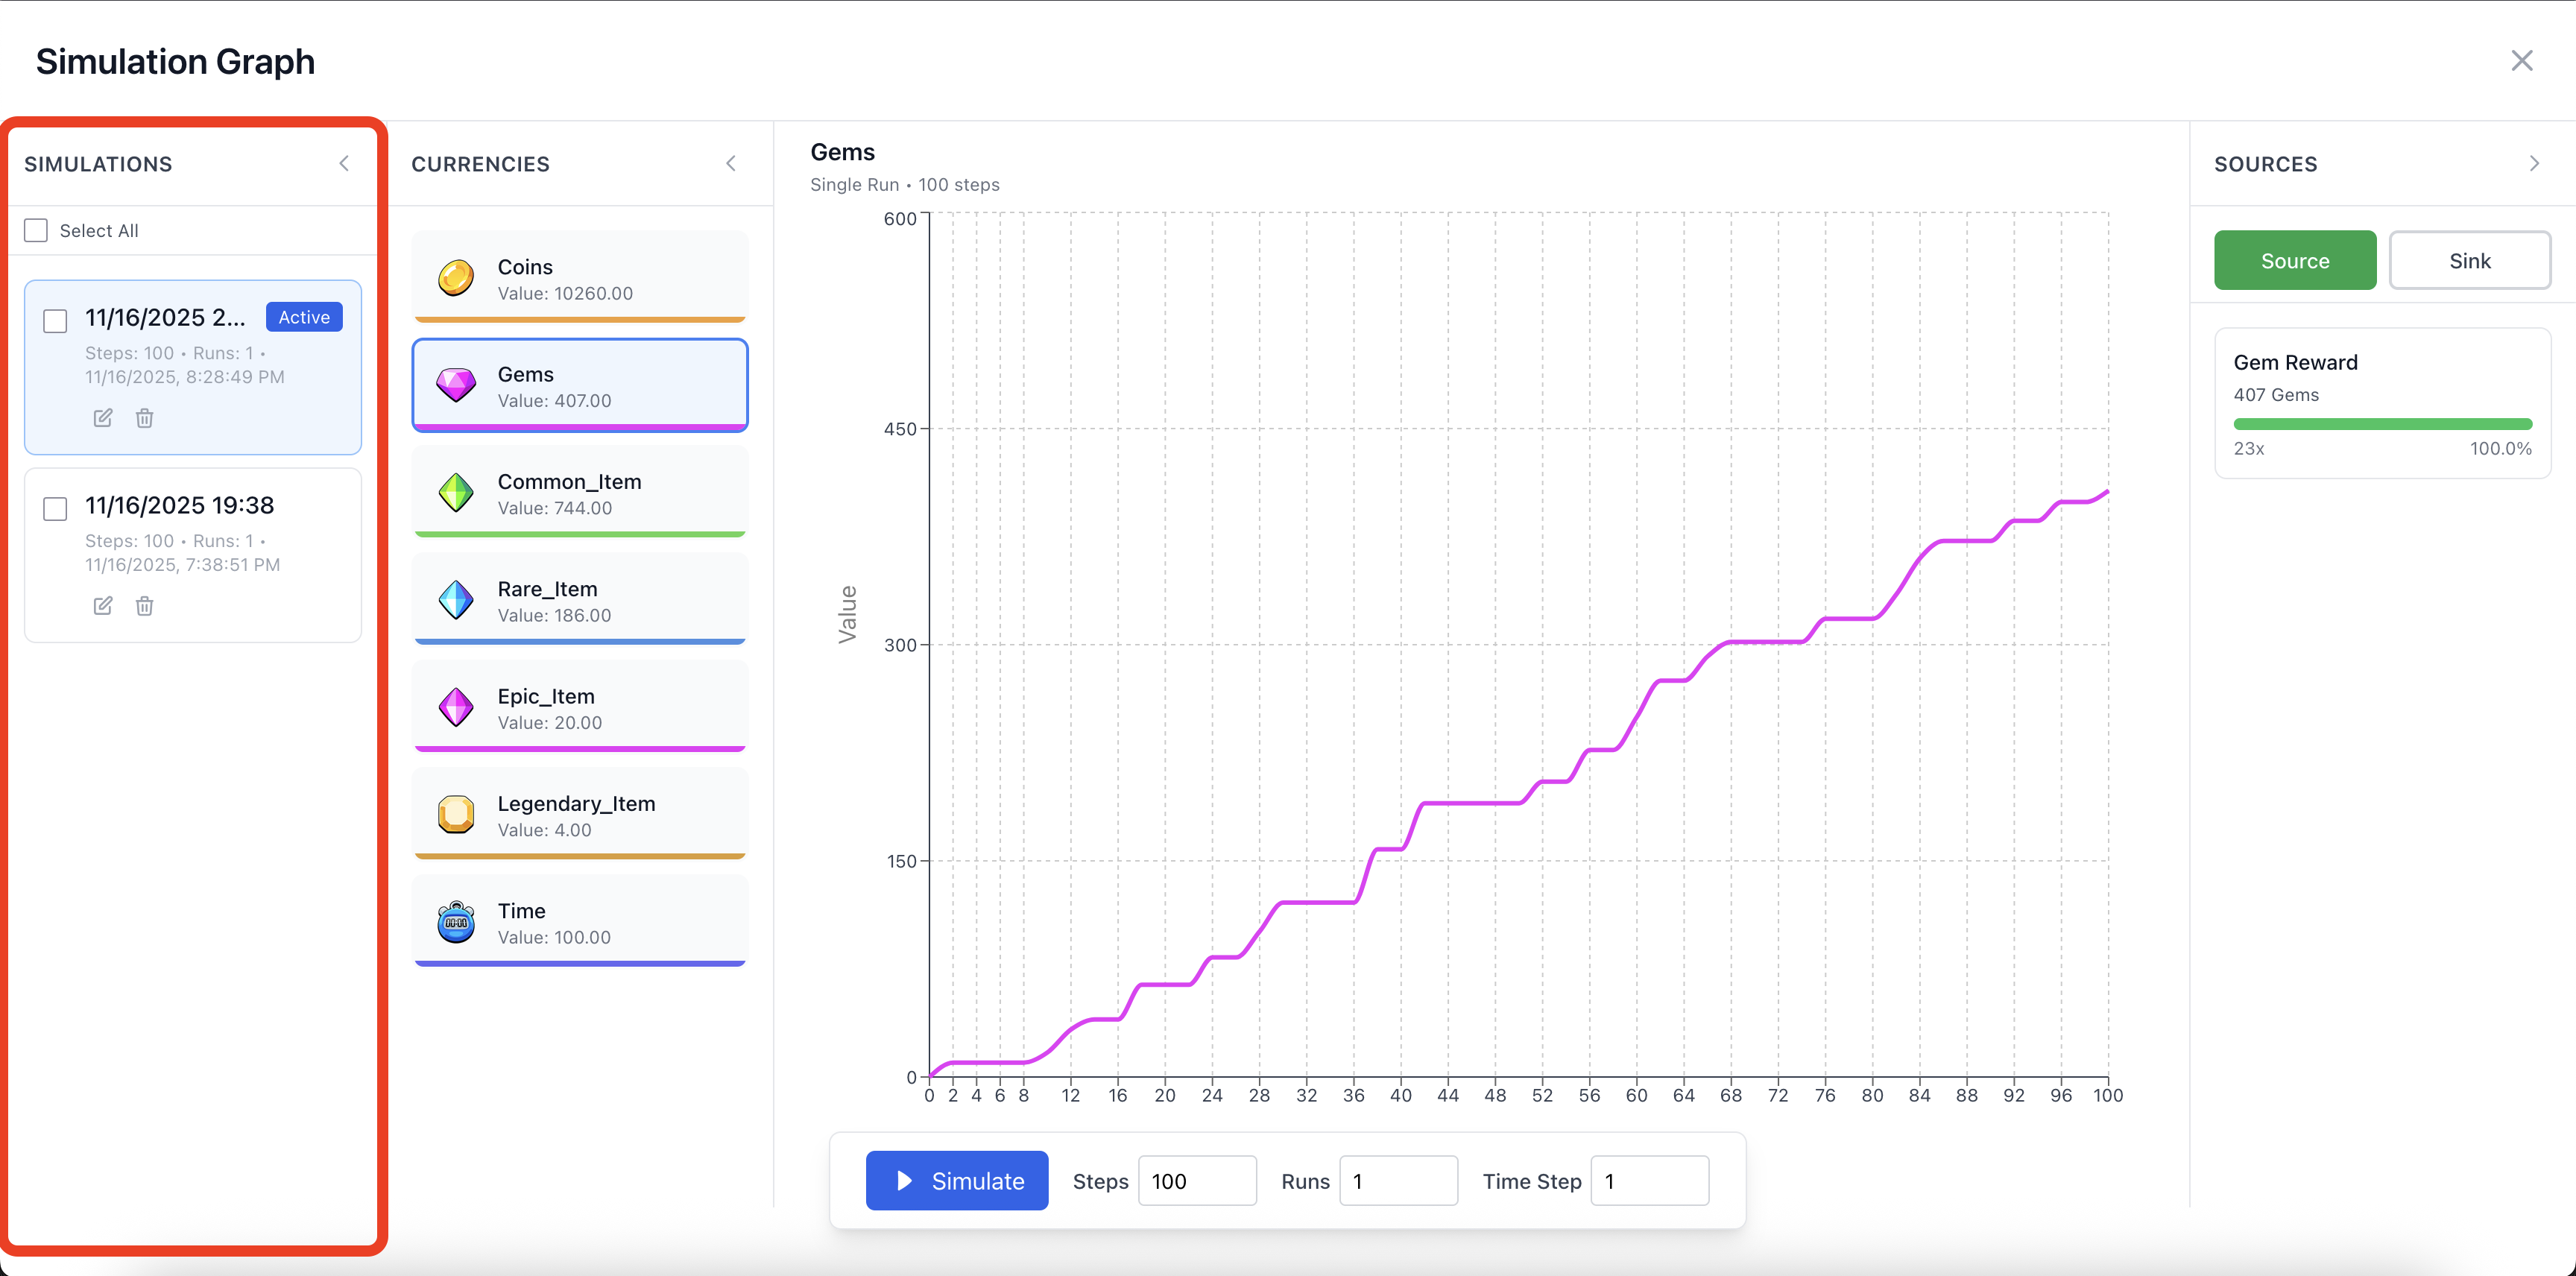
Simulation History
We keep Simulation History around so you have something to compare against. These are saved alongside your Workspace. The simulations can be renamed and you can manually clean them up as desired as well. When clicked, you'll be able to see all data associated with that simulation for comparison.
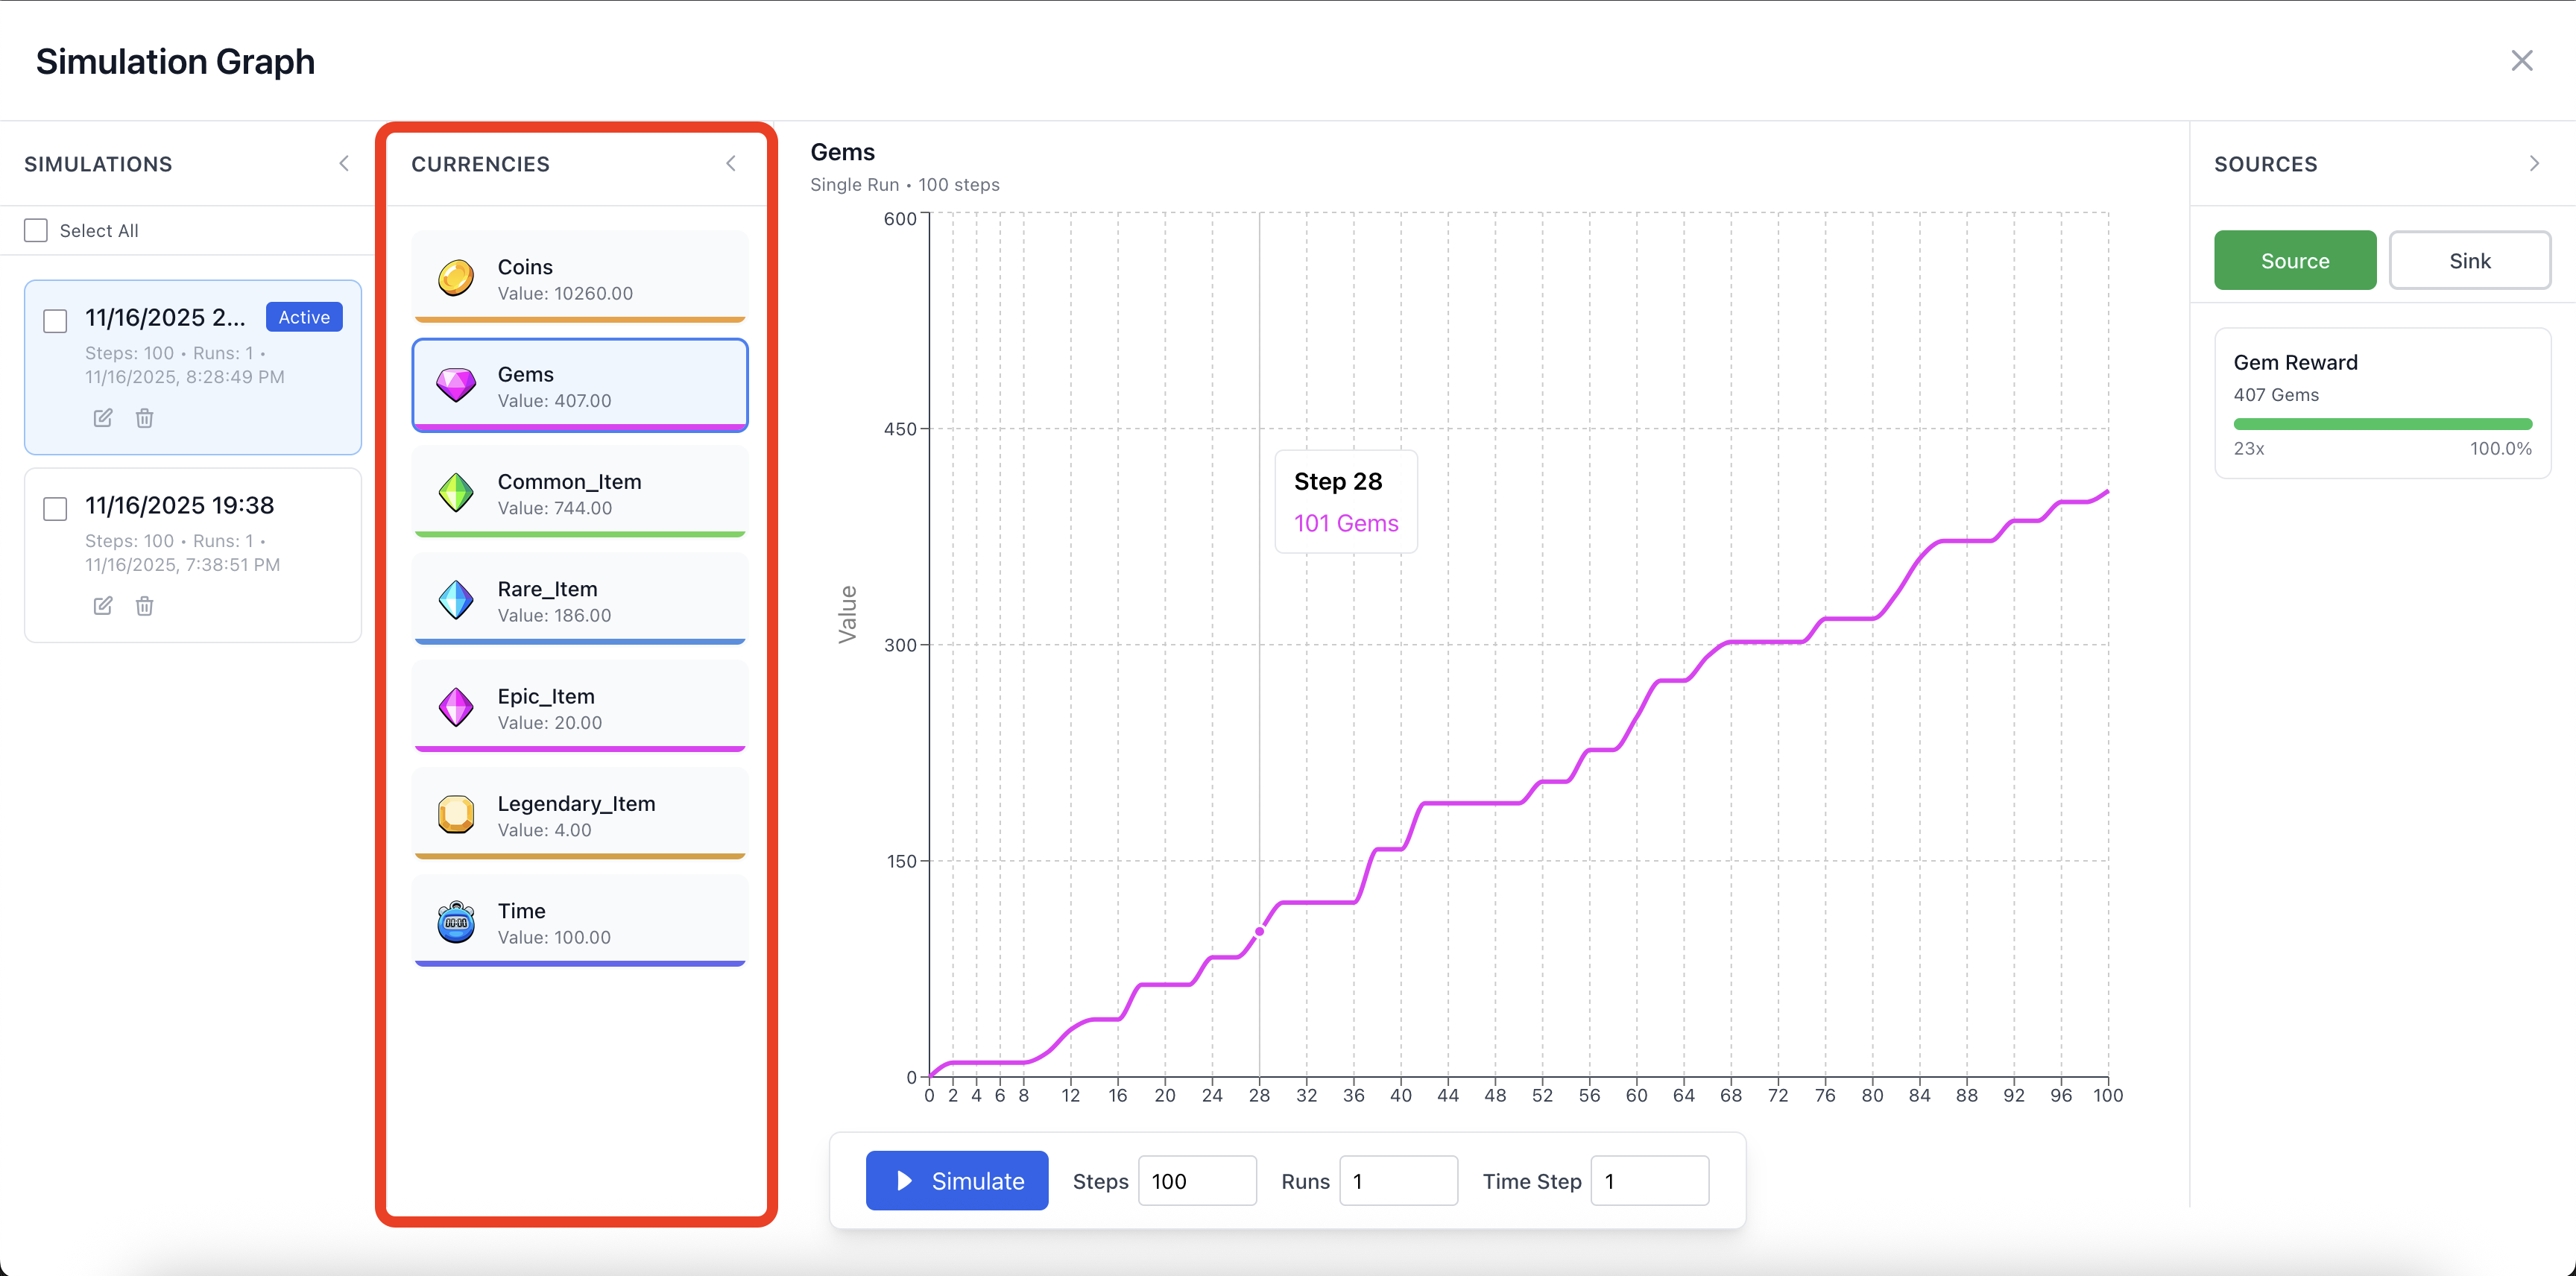
Currencies
In this column, you'll see all your currencies and their average value. The value displayed here, is the average value at the end of the simulation. You can click any of the currencies to see the corresponding graph.
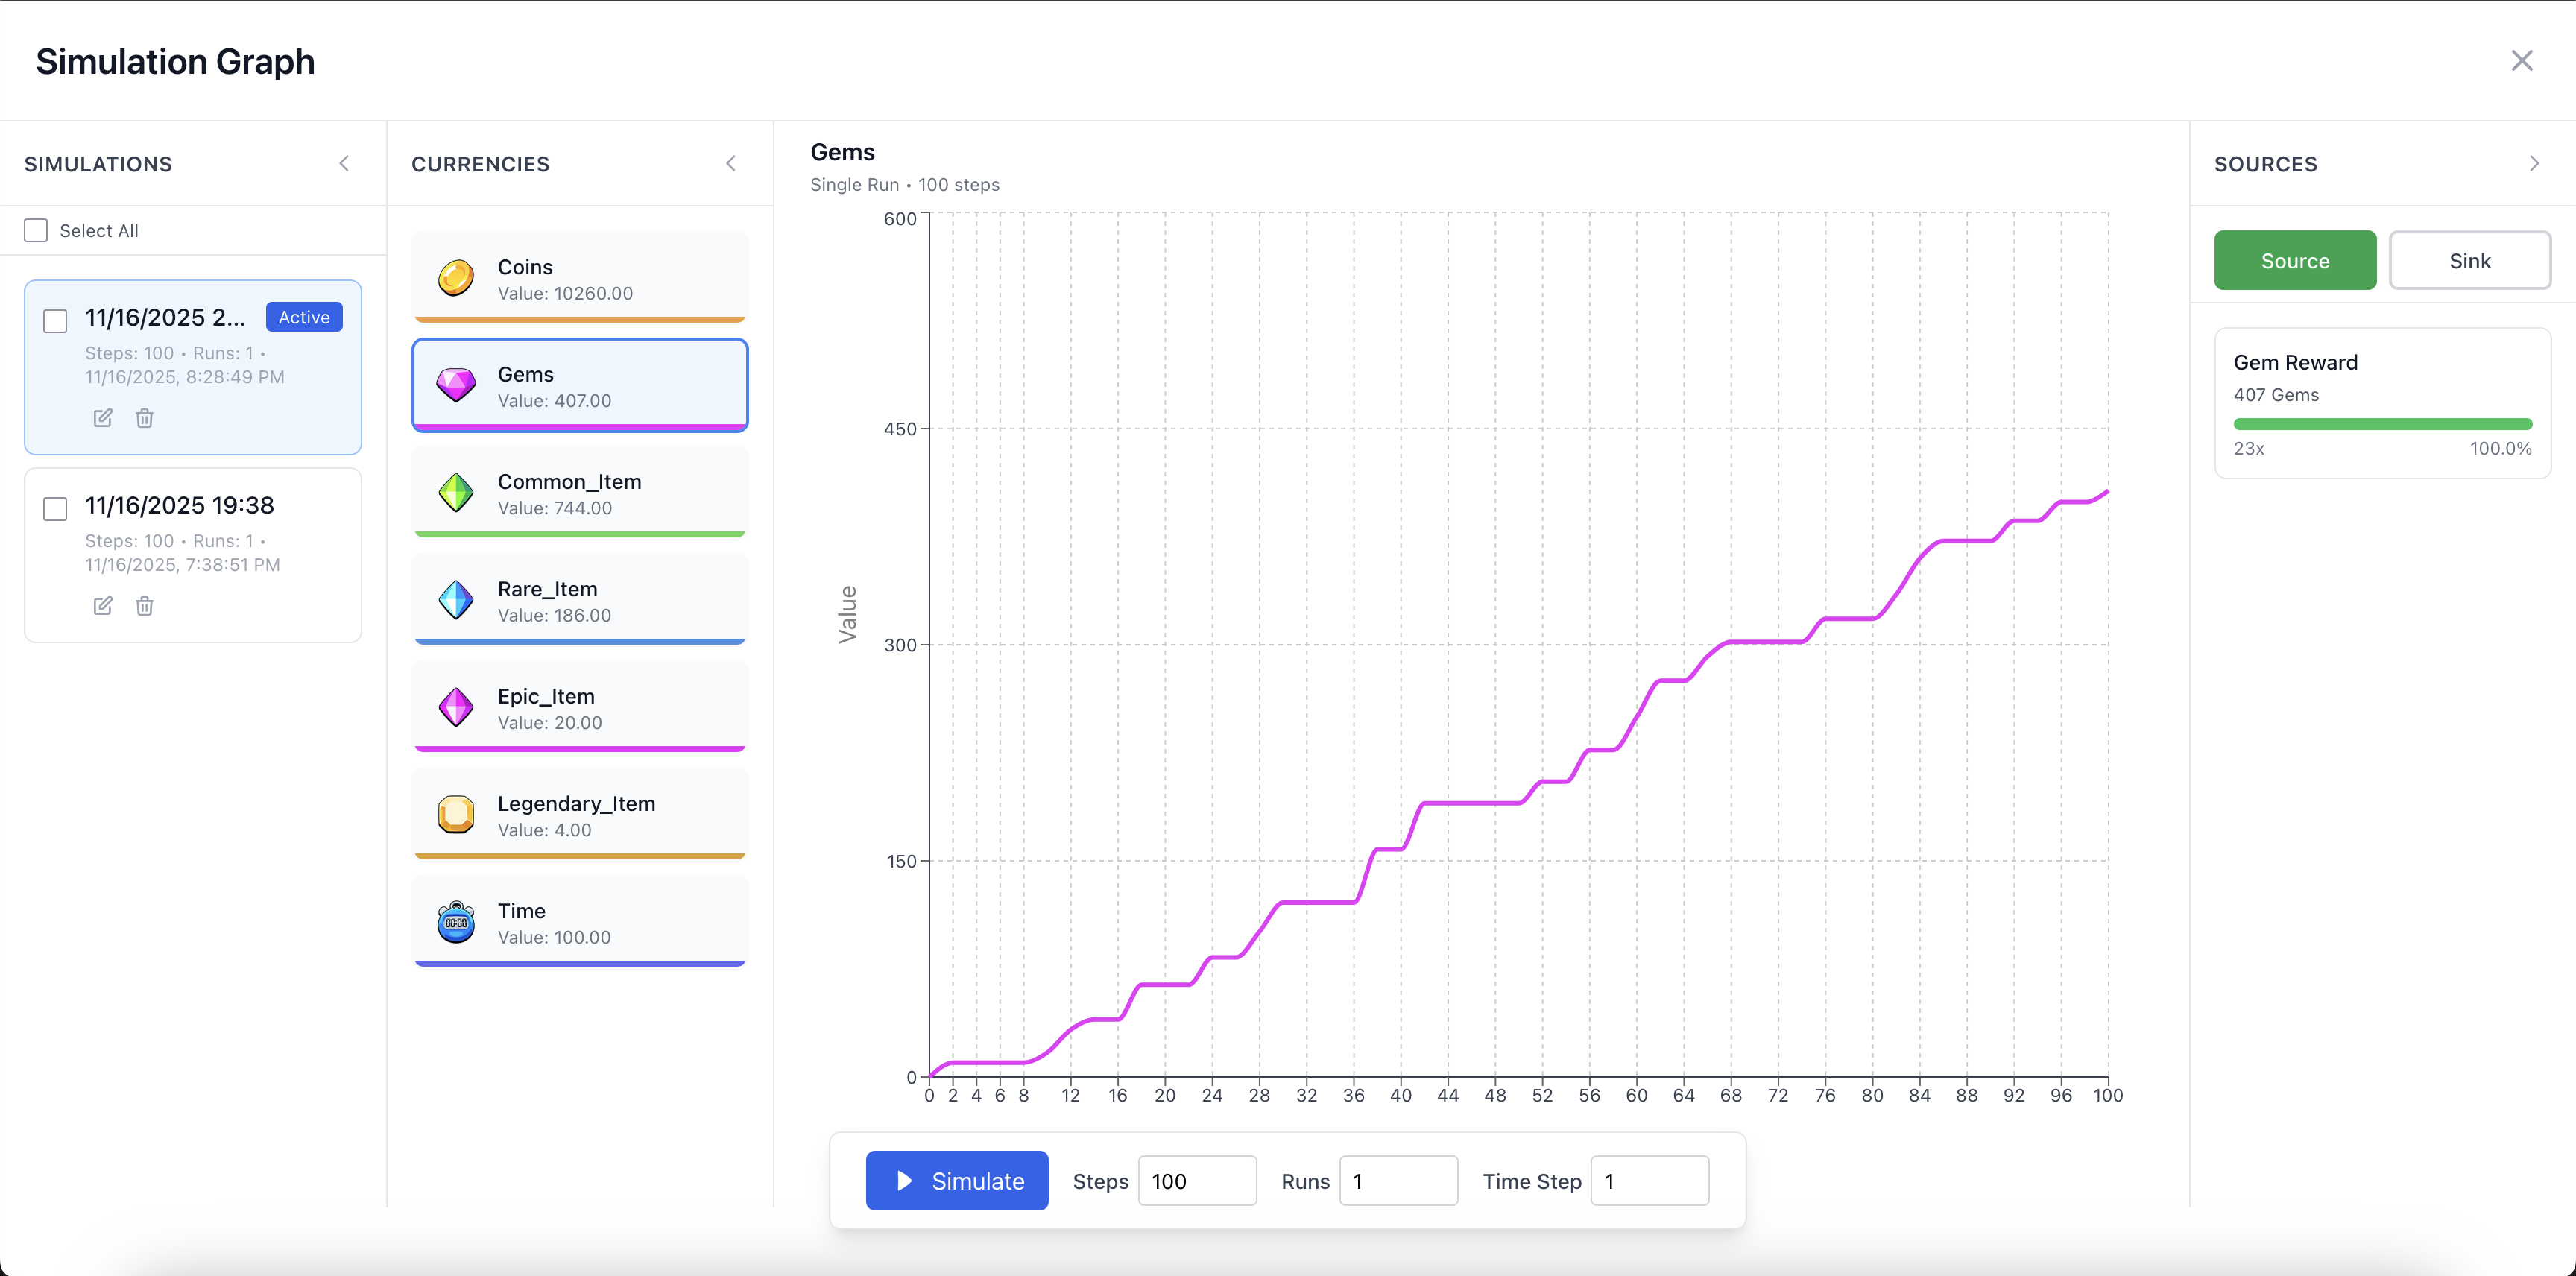
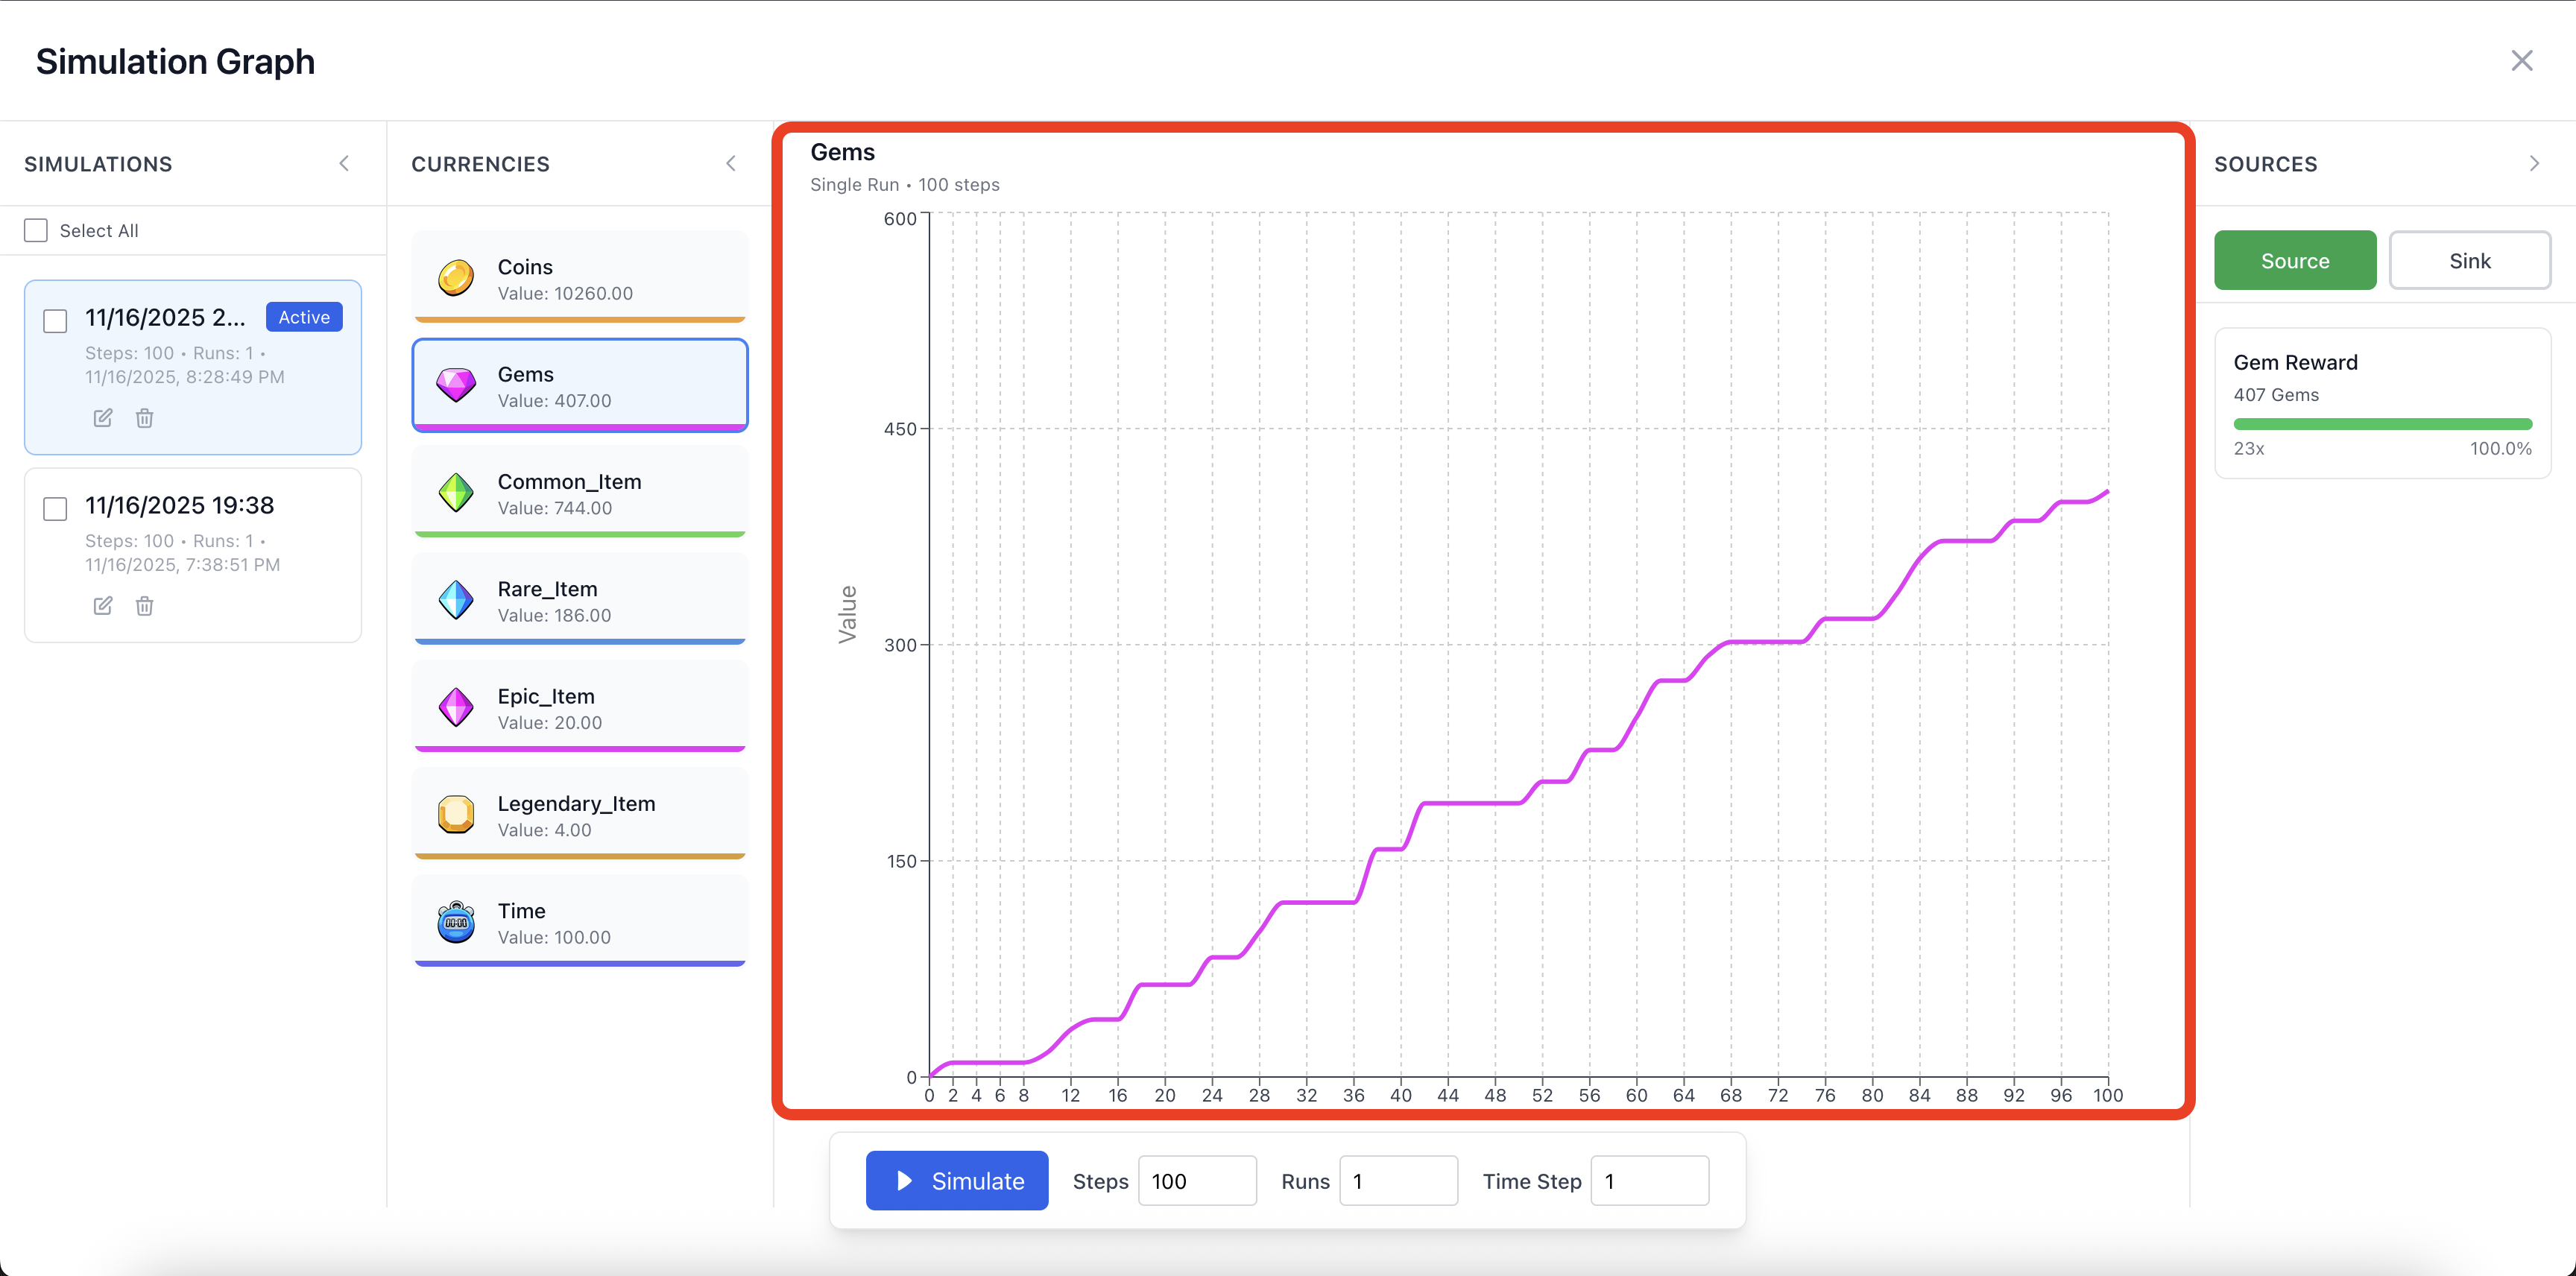
Graph View
The graph view displays the values across the simulation for the selected currency. The graph and system automatically sample points for maximum performance, so the X-axis is always limited to 75 data points. Internally, we use and clean up more data for accurate calculation. The graph view shows a maximum of 25 lines, with an Average and Median line as well.
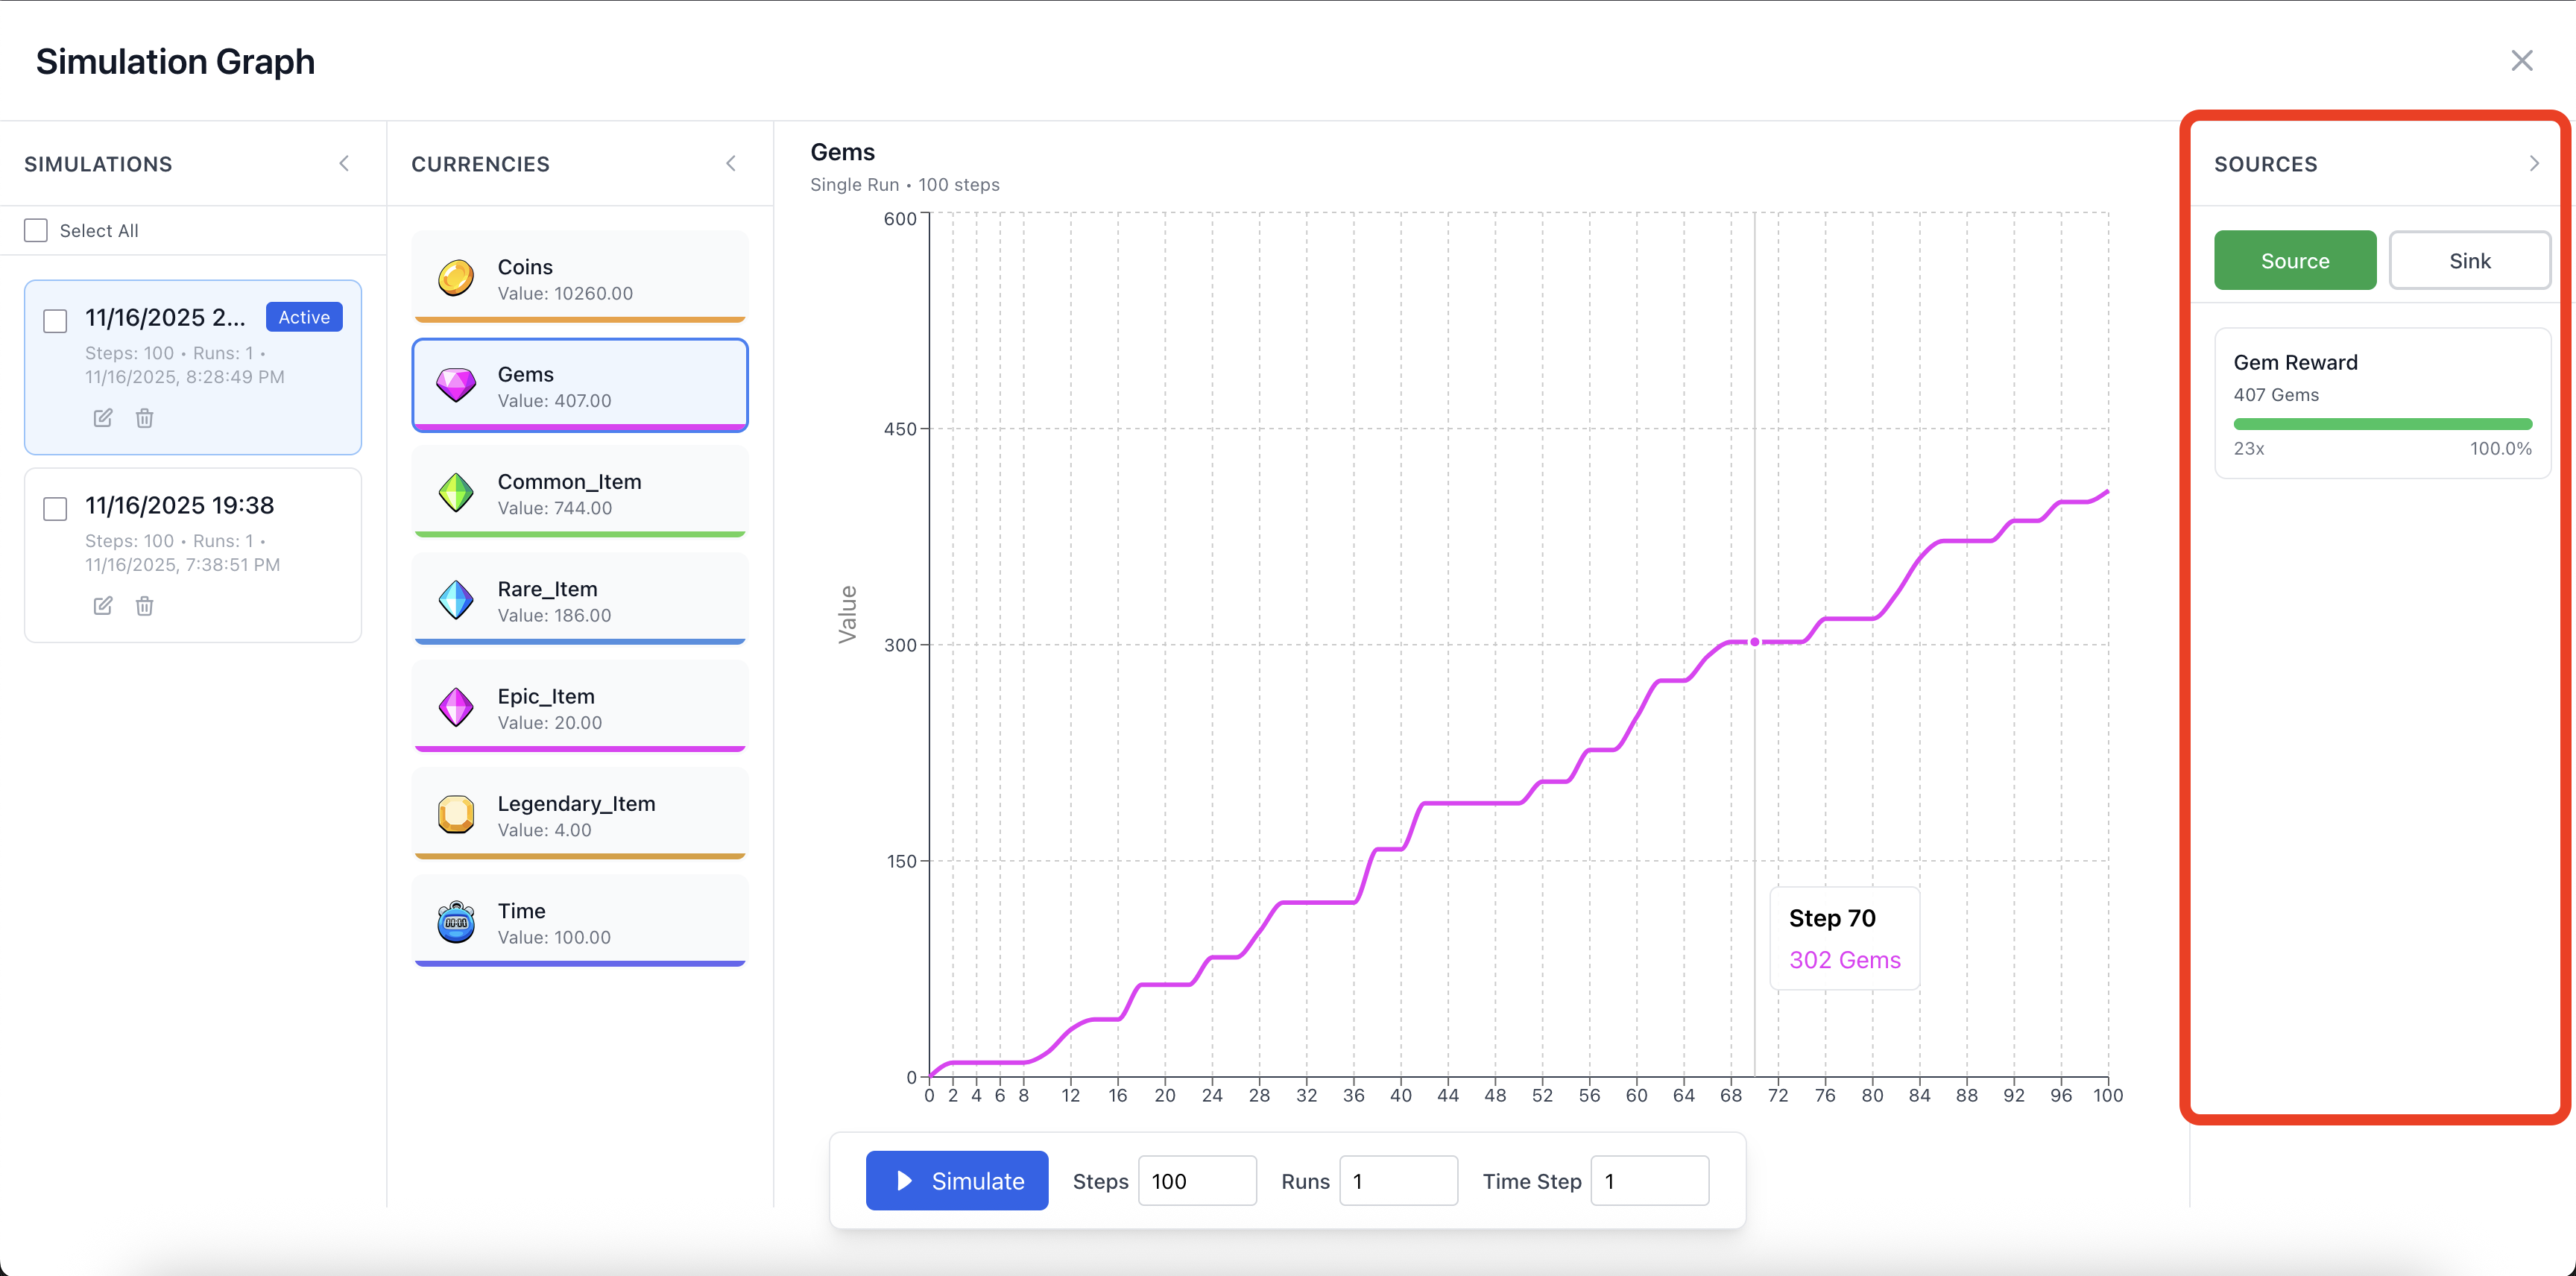
Simulation Sources and Sinks
These values indicate where the currencies are coming from and where they're moving into. This allows you to see a quick breakdown of the biggest influencers of your economy for that particular currency. It will also display the average amount obtained or sunk in a particular source or sink.
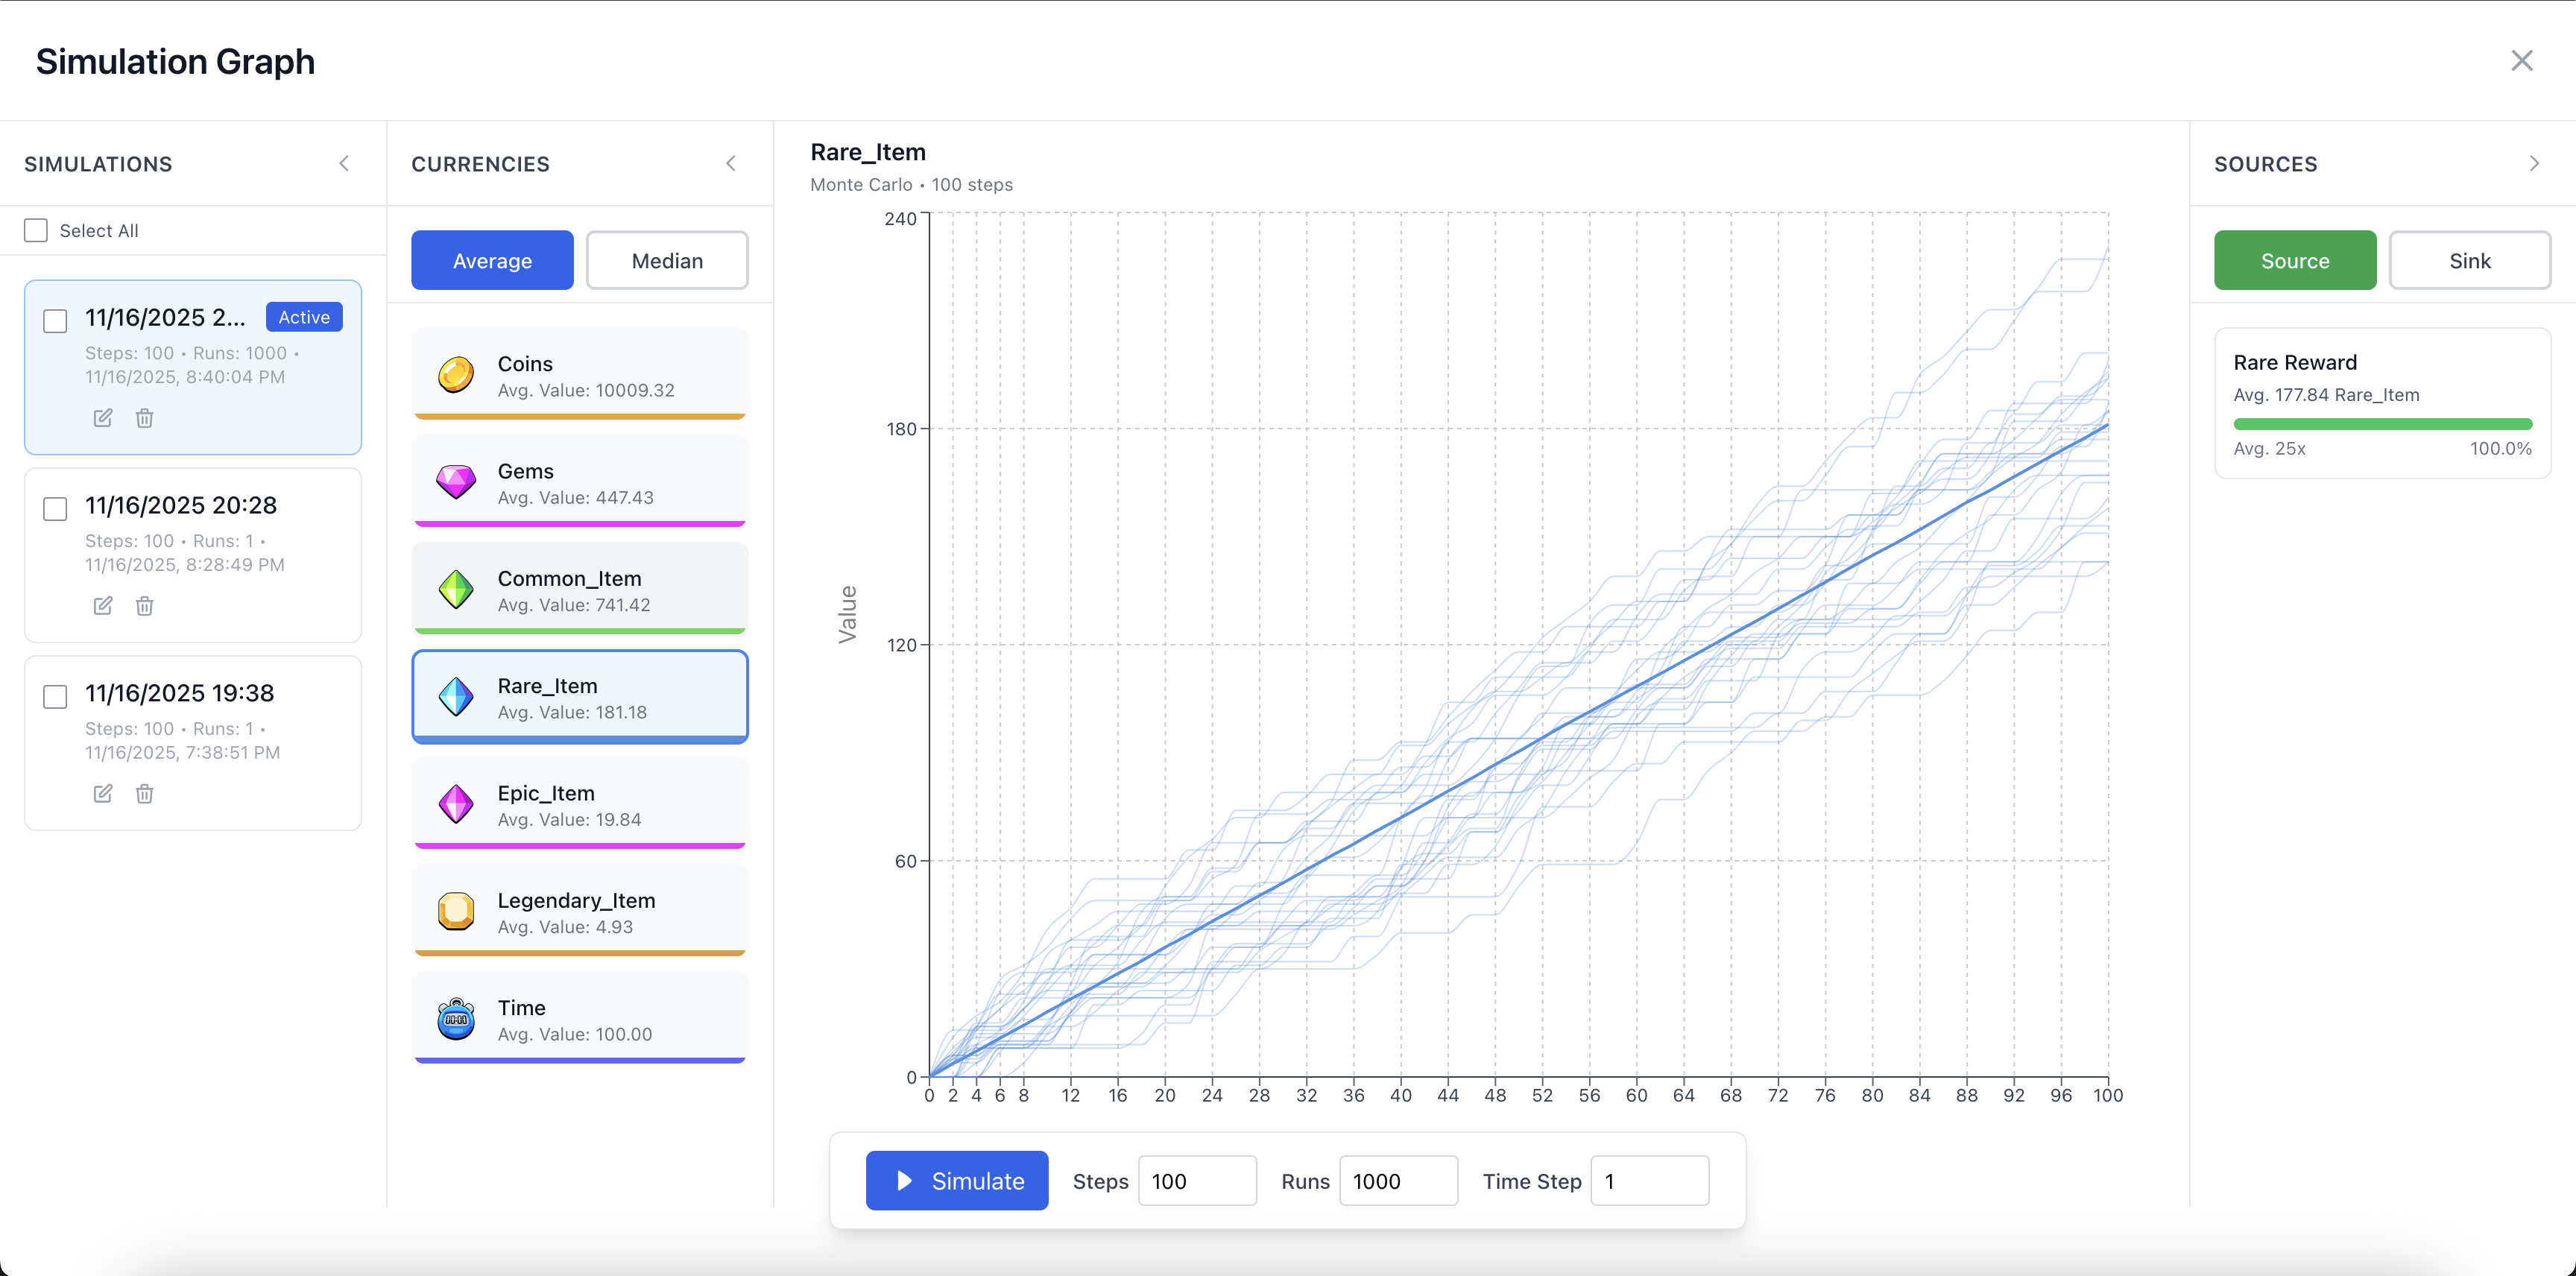
Monte Carlo
The main strength and purpose of the whole tool. This allows you to run your simulation thousands of times, getting a very strong average and median indicator of how a currency might progress. To run a Monte Carlo, simply increase the number of runs. If you set the settings to 100 steps and 1000 runs, we will run 100 steps, a 1000 separate times. This is a total of 100.000 operations (steps x runs), which is the limit for now.
This produces a 1000 lines with 100 steps. All this data will be used to calculate the Average and Median values that you'll easily be able to see and base your decisions on. To make the most use of this feature, run it, tweak your flow, run it again. Directly observe how the changes you make impact the economy or balancing.